Profiler
PUBLISHED
The profiler allows you to analyze the performance of your application. You can record, manage, and view profiling sessions.
Recording Profiling Sessions
To record a profiling session:
- In the Visual Studio menu, select Tools > Tizen > Profiler > Run Profiler.
The profiler configuration dialog opens.
- Define the profiling options.

- Path to application is automatically filled with the information for the current solution.
- Profiling Preset
You can select from the following predefined profiling configurations:
- CPU Sampling
Trace CPU and source lines, but not memory allocation.
- Memory Allocation
Trace memory allocation and source lines, but not CPU.
- Complex Profiling
Trace CPU, source lines, and memory allocation.
- CPU Sampling
- Sampling Options
You can set the following sampling options:
- Sampling Interval
You can set the sampling time interval, in milliseconds. The default is 10 ms.
- High Granularity
You can switch on high-granularity sampling. It enables better precision and sample regularity, at the cost of efficiency.
- Sampling Interval
- Trace Options
You can set the following trace options:
- Trace Execution
You can trace CPU utilization.
- Trace Memory
You can trace memory allocation for methods.
- Trace Garbage Collection
You can trace garbage collection.
- Trace Source Lines
You can switch on line source mapping.
- Stack Track
You can enable a hybrid trace, which registers stack changes on memory allocation.
- Trace Execution
- CPU Tracing Options
You can set the following CPU tracing options:
- Enable CPU Tracing
You can switch on the CPU tracing features.
- Trace Process
You can trace the application's CPU utilization.
- Trace Threads
You can trace each processing thread's CPU utilization.
- Trace Interval (ms)
You can set the sampling time interval, in milliseconds.
- Enable CPU Tracing
- Misc Options
You can set the following additional option:
- Delayed start
You can delay the application startup.
- Delayed start
- To start the profiling session, click OK.
The application is installed and launches on the emulator.
The Output panel displays the installation log, including any errors.

The Profiling Progress panel shows live CPU and memory usage information.

- To pause and resume profiling, in the Profiling Progress panel, click Pause and Resume.
The chart in the Profiling Progress panel uses a light-blue background to distinguish the time period when profiling is paused.
- To stop profiling, click Stop.
The application is terminated and the profiling data is retrieved from the emulator.

Managing Profiling Sessions
To manage the recorded profiling sessions:
- In the Visual Studio menu, select Tools > Tizen > Profiler > Session Explorer.
The Session Explorer panel opens. It lists the profiling sessions collected from the current solution.

- You can add a user-defined annotation to a session to, for example, identify what was tested during that session.
To add an annotation:- In the Session Explorer, right-click the session and select Edit Annotation.

- Enter the annotation text, and click Ok.

- In the Session Explorer, right-click the session and select Edit Annotation.
- To view the session properties, click the session in the Session Explorer.
The Properties panel (below the Session Explorer panel by default) displays additional information about the session, such as the profiling options used for the session.

- To delete a session, in the Session Explorer, right-click the session and select Delete.
Viewing Profiling Sessions
To view a profiling session, in the Session Explorer, double-click on the session you want to view.
A session view opens, consisting of 3 panels:
- Filters panel on the left
- Timeline panel in the center
- Methods panel on the right
Figure: Session view

Filters Panel
You can filter the profiling data by selecting from the following options:
- Call Tree and Methods filters define which information is displayed in the methods panel:
- Time shows how much time each method has occupied.
- Allocated Memory shows how much memory was allocated for each method.
- Samples shows the number of samples for each method.
- Thread Timeline filters define which information is displayed in the timeline panel.
You can display GC (garbage collection), JIT (just-in-time compilation), or Cpu Utilization.
Timeline Panel
The timeline panel consists of 2 parts:
- The upper part of the panel shows the overall CPU utilization chart.

- The lower part of the panel shows GC, JIT or CPU utilization charts for each thread, depending on the selected filter.

You can select a specific time interval on the timeline, to view the detailed method data for it.
To select a time interval:
- Highlight the interval you want to view in the upper part of the timeline panel.

The methods panel shows data for the selected interval.
- To clear the selected interval, click anywhere in the timeline chart.
Methods Panel
The criteria for the data shown in the methods panel depends on the selected filter. The following figure shows examples of the data displayed in the methods panel.
Figure: Method filters

The methods panel consists of 3 tabs:
- The Call Tree tab displays the Top Methods and Call Tree for the selected thread and time interval.

-
The Hot Path tab displays the hottest paths for the selected thread and time interval.

The list displays the hottest methods. To view the call path from the method to its root, expand the list item.
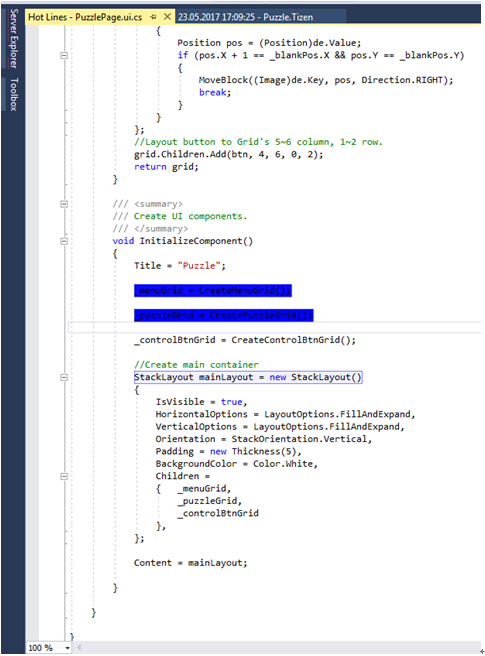
- The Hot Lines tab displays the top source lines for the selected thread and time interval. The source line numbers are shown in brackets ([ ]).

To show a "hot line" entry in its source code context, double-click the method in the Hot Lines tab. The code line is highlighted with a color intensity corresponding to its hotness.
Figure: "Hot line" in context